Wind Energy Barometry
a study carried out by EurObserv’ER, 2019
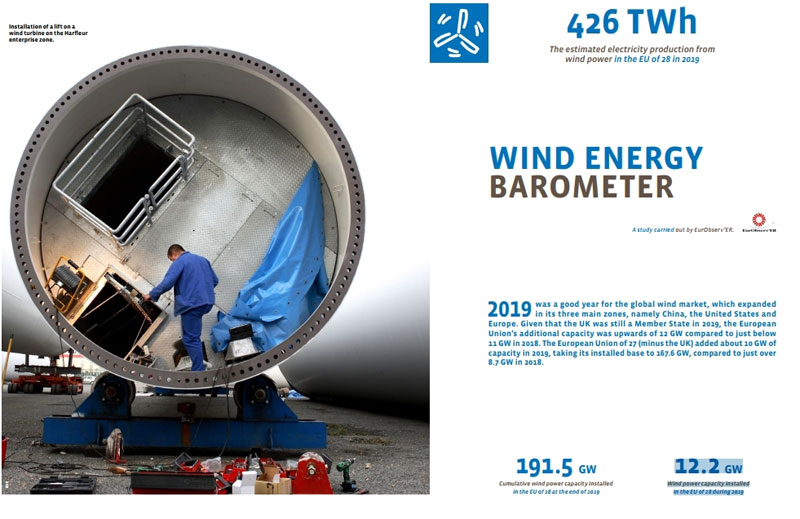
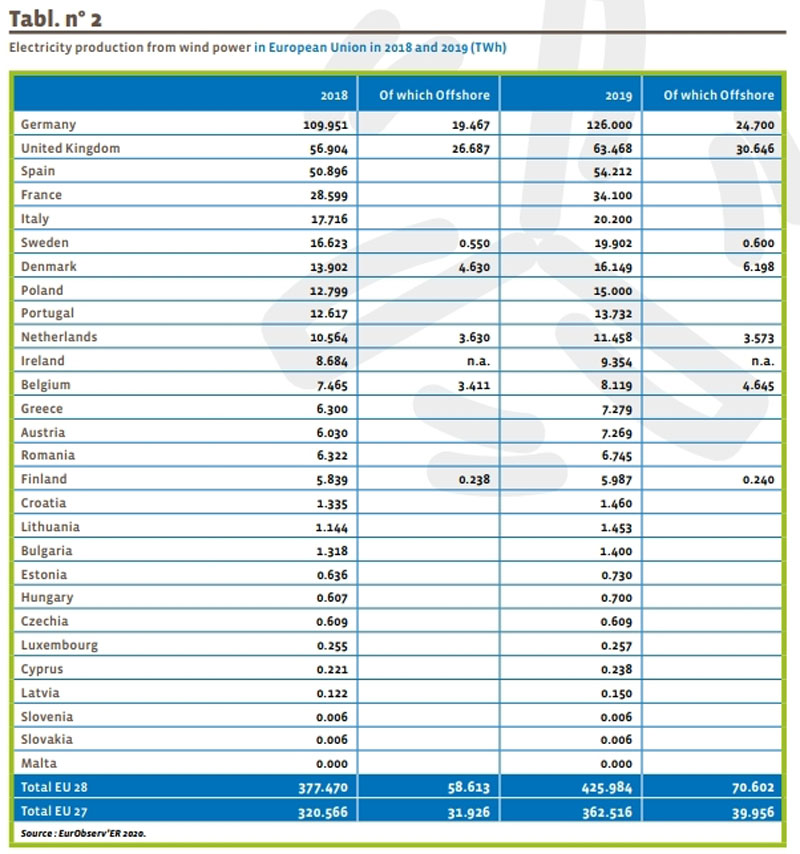
426 Twh The estimated electricity production from wind power in the EU of 28 in 2019
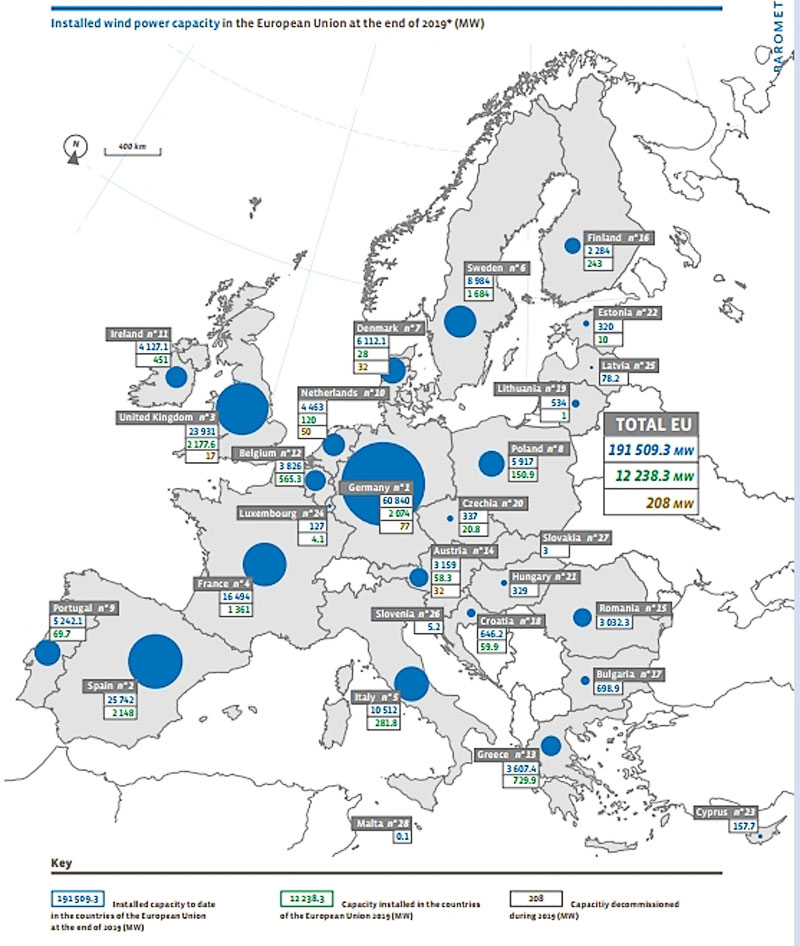
191.5 GW Cumulative wind power capacity installed in the EU of 28 at the end of 2019
12.2 GW Wind power capacity installed in the EU of 28 during 2019
2019 was a good year for the global wind market, which expanded in its three main zones, namely China, the United States and Europe. Given that the UK was still a Member State in 2019, the European Union’s additional capacity was upwards of 12 GW compared to just below 11 GW in 2018. The European Union of 27 (minus the UK) added about 10 GW of capacity in 2019, taking its installed base to 167.6 GW, compared to just over 8.7 GW in 2018.
News from around the main markets
Global installed wind capacity grew significantly in 2019. The analysts forecast 58–71 GW of new capacity, compared to 51.3 GW in 2018 (according to the GWEC). If these figures are confirmed, they could amount to the highest wind energy total ever commissioned in a single year. Most of this sharp increase can be ascribed to positive growth in China, North America and Europe as well as remarkable worldwide growth in the offshore wind segment.
Wind energy takes off in China
According to the China Electricity Council, the country installed 25 740 MW of wind capacity in 2019 as against 21 270 MW in 2018. This 21% growth took China’s installed capacity to 210 050 MW by the end of 2019 (184 270 MW at the end of 2018). The same source claims that wind energy output exceeded 400 TWh in 2019, 405.7 TWh to be precise (365.8 TWh in 2018). The Chinese wind sector’s watershed was its government’s May 2019 announcement that from the start of 2021, onshore wind electricity Feed-in Tariffs could no longer exceed those of electricity produced in coal-fired plants. The government views that the Chinese wind energy sector is now mature enough to cope without incentives.
The National Development and Reform Commission (NDRC) indicated that the tariffs paid to onshore wind power projects will fall to 0.29 yuan (€ 0.038) per kWh in 2020, while network price parity with electricity generated using coal will apply to all new projects from 1 January 2021 onwards. Thus, Beijing confirms last year’s renewable energy support policy shift towards phasing out subsidies to the sector. In May 2019, the NDRC also published an initial list of approved subsidy-free projects for a capacity of 20.8 GW including 168 solar sites for a capacity of 14.78 GW and 56 onshore wind projects for a capacity of 5.71 GW. Another reason for this policy to accelerate network parity was to clear the huge backlog of subsidy payments for existing projects.
Analysts Wood Mackenzie Power and Renewables reckon that this decision should encourage developers to install as many wind turbine sites as possible during 2020, with expected additional capacity put at about 28 GW. The analysts expect the market to contract by about 23% in 2021 when the new “subsidy-free” policy comes into force. Furthermore, the Wood Mackenzie analysts cast doubt on the developers’ capacity to achieve parity with coal by the deadline and forecast that they are unlikely to do so before 2023. This will incur serious financial consequences for project developers in China.
Furthermore, while onshore wind power is already on the rails, China is increasingly engaged in the offshore wind segment. China Three Gorges (CTG) has started constructing TWo super projects which will be fully operational in 2021. The Yangjiang Shapa Wind Farm (1300 MW), off the coast of Yangjiang City in Guangdong province and the Jiangsu Rudong project (800 MW), off the coast of Rudong city in Jiangsu province. CTG points out that phase 1 of the Yangjiang Shapa project (300 MW) is already up and running and that it delivered its first kWh in November 2019. The Global Offshore Wind Report 2019 of the World Forum Offshore Wind (WFO) claims that China, with 3.7 GW under construction at the start of 2020, is well on the way to becoming the global offshore market leader.
the United states passes the 100-gW mark
Wind is on a winning streak in the United States. AWEA (American Wind Energy Association) data indicates that last year the US installed 9 143 MW of wind capacity (7 588 MW in 2018), which amounts to 20.5% growth. It takes US capacity to date to 105 583 MW, making 2019 the third best year for annual installations (the record was set in 2012 with 13 341 MW installed). Both short- and medium-term growth prospects remain positive. At the end of 2019 there were 22 115 MW of projects under construction, and 22 038 MW of projects at the advanced development phase (including 7 483 MW of offshore).
The capacity of these ongoing projects is 26% higher than last year. Another emerging trend is capacity build-up through Power Purchase Agreements (PPAs). These contracts are entered into by producers and major electricity consumers, enabling the former to guarantee the profitability of their power plants by ensuring that the output is sold at a predetermined price. According to AWEA, project developers claim to have clinched almost 8 726 MW in power purchase agreements in 2019, 2 077 MW of which was announced during the last quarter of the year. It should be pointed out that the wind production tax credit (PTC) was due to be completely phased out at the end of 2019, but thanks to a late change to the tax law, it has been extended through to the end of 2020.
As a result, wind projects whose construction started in 2019 are eligible for 40% tax credit and those that start construction in 2020 will be eligible for a 60% tax credit. In detail, the PTC awards a tax credit of 2.5 cents (US$ 0.25) (2019 projects) for each kWh of electricity sold for a 10-year period after the wind farm’s commissioning date.
an additional 12 gW if not more in the EU of 28
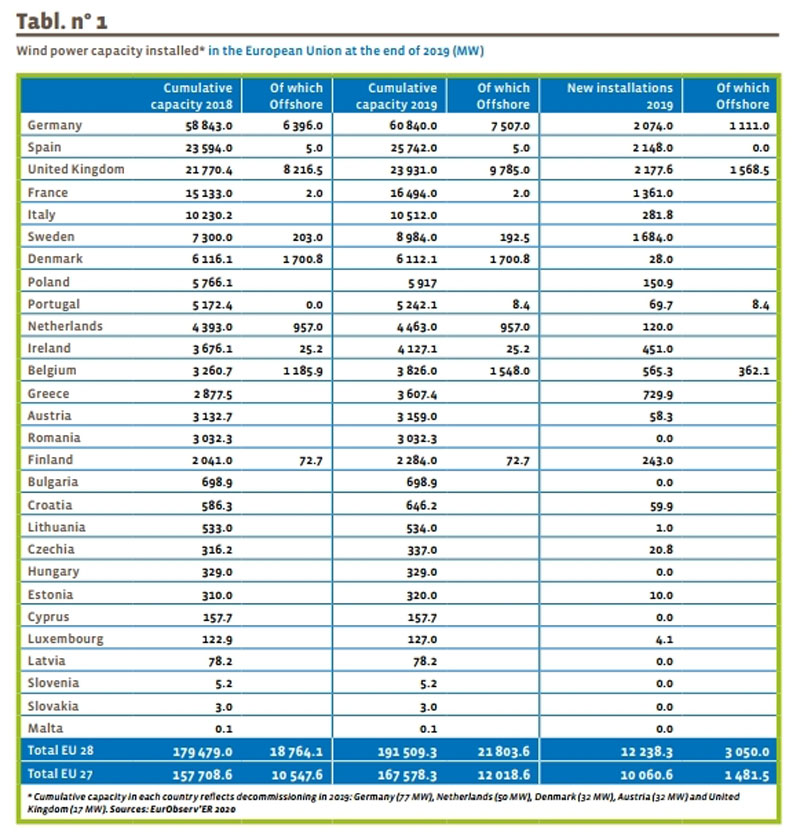
The EurObserv’ER indicators are based on the data collected from ministries, statistics offices, national energy agencies or grid managers. In the absence of other information sources, they are supplemented using data produced by the national wind energy associations or syndicates (see the list of sources at the end of this barometer). This method differs from that of WindEurope, the European sector’s association, thus, their indicators may differ slightly from ours. According to our barometer, the newly-installed capacity figure for the EU in 2019 (which at the time still had 28 Member States) was about 12 238.3 MW. If we subtract the year’s decommissioned wind turbine capacity (208 MW according to EurObserv’ER), the net addition was 12 030.3 MW in 2019 (10 906.5 MW in 2018), taking the European Union’s wind turbine base to 191 509.3 MW.
The figure for 2019 has not been finalized and should improve when the UK’s 4th quarter installation data is published. The main explanation for this upswing is the revival of the Spanish market which grew by 2 148 MW according to RED Eléctrica (compared to 463 MW in 2018). Momentum is also very positive in Sweden (1 684 MW of additional capacity, compared to 689 MW in 2018), as well as Greece (729.9 MW added compared to 253.5 MW) and Finland (243 MW added, compared to 0 MW in 2018). The main negative factor was onshore wind energy in Germany which for the first time since 2008 fell below the GW threshold in 2019 (963 MW), resulting in a lower level of onshore wind turbine installation than the offshore segment (1 111 MW) and leading to 2074 MW of newly-installed capacity.
The annual connected capacity figure for France fell for the second year running amounting to 1 361 MW in 2019 (1 788 MW in 2017 and 1 583 MW in 2018). The additional capacities in Italy and the Netherlands fell back sharply, Denmark’s efforts were effectively negative because newly-installed onshore capacity (28 MW) was lower than decommissioned capacity (32 MW). Denmark’s official statistics do not faithfully reflect the wind energy sector’s real activity. This is because, while the Horns Rev 3 offshore Wind Farm (406.7 MW) came on stream in 2019, it will not be officially included in the statistics until 2020.
Again, from a statistical perspective, the European Union is losing a key wind energy player with the UK’s departure, particularly in the offshore wind energy segment. To clarify this, table 1 presents the situation of the new European Union of 27. It puts newly-installed capacity at about 10 GW (10 060.6 MW) in 2019 with 167 578.3 MW of capacity to date.
offshore... more than 2019.
Preliminary figures for newly connected capacity suggest an increase of at least 3 050 MW (2 971.4 MW of new capacity in 2018). This figure will rise when the UK’s DBEIS (Department for Business, Energy & Industrial Strategy) releases its official data for the fourth quarter. In the meantime, the “Offshore Wind in Europe, Key trends and statistics 2019” report published by WindEurope, claims that 1 764 MW of new capacity was connected in 2019.
This estimate tallies with the DBEIS figure of 1 565.8 MW for the first three quarters of the year. The WindEurope estimate includes the full connection of the Beatrice 2 Wind Farm, the full connection of the Hornsea One Wind Farm which took three years to construct and is the world’s biggest offshore wind farm (1 218 MW) and the partial commissioning of East Anglia Offshore Wind 1.
Note that in 2019, the Blyth Phase 1 demonstrator, comprising TWo 2-MW turbines, was the first wind farm to be decommissioned after 19 years in service. Germany officially brought 1 111 MW online by commissioning three new wind farms: Merkur Offshore (252 MW), Deutsche Bucht (260.4 MW) and EnBW Hohe See (497 MW). The latter is the country’s biggest offshore wind farm. Belgium fully connected Norther (369.6 MW), comprising forty-four 8.4-MW turbines (Vestas V164-8.4 MW turbine).
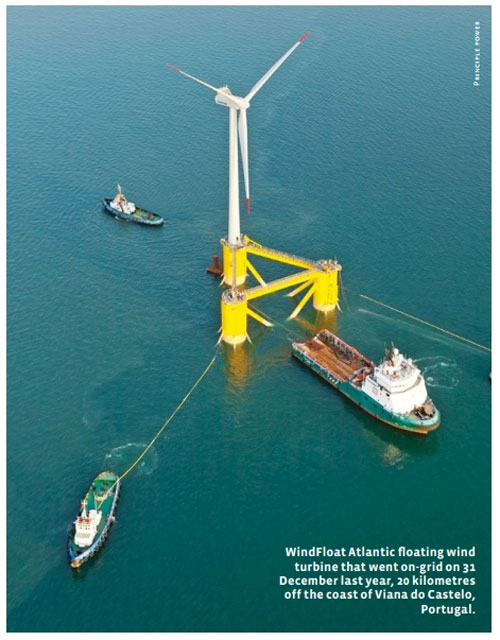
The wind farm is expected to produce 1.4 TWh (which corresponds to an annual load factor of 43.1%) equivalent to the average consumption of 400 000 households. Portugal, via the Directorate General for Energy and Geology, officially accounted for the first of three floating turbines (all of the V164-8.4 MW type) which will make up the Windfloat Atlantic Phase 1 platform. As mentioned above, Denmark inaugurated the Horns Rev 3 Wind Farm with total capacity of 407 MW.
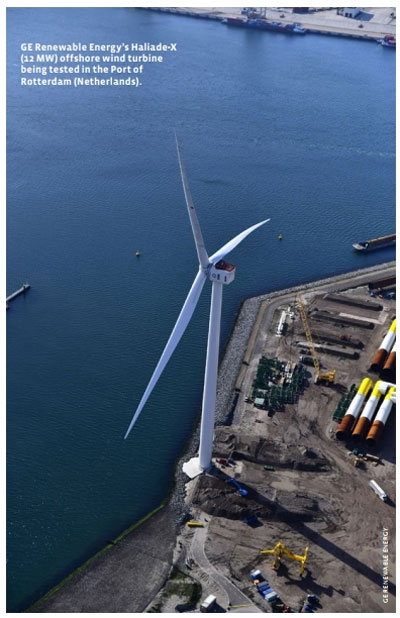
The Netherlands has not officially added any capacity but is currently working on constructing the Borssele Wind Farm, whose phases 3&4 are scheduled for 2021 (i.e. seventy-seven V164.5–9.5 MW turbines). Furthermore, the country has been testing the first GE Haliade-X 12 MW prototype on land in the Port of Rotterdam since November 2019. Construction of 4 other wind farms was underway in 2019 – the EnBW Albatros (16 Siemens Gamesa SWT-7.0-154 turbines) by Germany and the 3 Belgian wind farms of Northern Wind 2 (23 Vestas V164-9.5 MW turbines), Mermaid (28 Siemens Gamesa SG 8.4 MW-167 DD turbines), and Seastar (30 Siemens Gamesa 8.4 MW-176 DD turbines).
Another major trend identified by WindEurope in its latest report is the significant increase in the average capacity of offshore wind turbines. They have increased by 16% per annum since 2014. In 2019, the average size of installed turbines was 7.8 MW, namely 1 MW more than in 2018. The most powerful gridconnected wind turbine was the V164- 8.4 MW in 2019.
Wind energy output in the EU of 28 stands at 426 tWh
In 2019, electricity generation from wind turbines generally enjoyed more favourable wind conditions than in 2018, especially in the North Sea, Germany and France. This contrasts with the UK that had poor wind conditions especially in the last quarter, which were offset by the thrust of its offshore wind segment of new-generation wind turbines with their higher load factors.
According to EurObserv’ER, potential wind energy should amount to 426 T Wh, which equates to double-digit (12.9%) growth over the previous year or a 48.5-TWh increase. Offshore wind energy growth was even more sustained (20.5% more than in 2018), increasing (by 12 TWh) from 58.6 TWh in 2018 to 70.6 TWh in 2019. Offshore wind thus accounted for 16.6% of 2019’s wind energy output in 2019 as opposed to 15.5% in 2018. The three countries that contributed most to the increase in production are Germany with an additional 16 TWh (for a total of 126 TWh in 2019, 14.6% growth), the UK (by adding 6.6 TWh, for a total of 63.5 TWh, 11.5% growth) and France (which added 5.5 TWh, totalling 27.8 TWh, 19.2% growth). Sweden (which added 3.3 TWh, 19.7% growth) and Denmark (which added 2.2 TWh, 17.2% growth) also made significant gains in output. Belgium’s wind power production stands out because most of it is generated by its offshore facilities (57.2% in 2019). The UK’s offshore wind facilities produce almost half of the country’s wind power output (48.3% in 2019).
According to EurObserv’ER, the mean load factor of the European wind turbine base was about 24.6% for onshore facilities and 39.7% for offshore facilities (taking the combined capacity of the base at the end of 2018 rounded up by half of the additional capacity installed during 2019 as the reference point). This performance is representative of the entire European Union base, including the oldest wind farms. According to WindEurope, the load factors of the new turbines, that have much longer blades, capable of generating electricity at much lower wind speeds, are very much higher. For onshore wind energy they range from 30 to 35%, and as for the new offshore projects, they can be up to 55%, based on the production readings made by the energynumbers site 1.
news from around the main european markets
Revival of the Spanish market
Spain posted excellent end- of-year results for new wind capacity and electricity output. Data released by Red Eléctrica de España (REE) shows that wind capacity rose by 2 148 MW from 23 594 MW in 2018 to 25 742 MW in 2019. This takes Spain to second place in the European Union rankings for installed turbine capacity, behind the UK but ahead of Germany, and can be explained by the Spanish government’s new tendering policy. It organized TWo consecutive renewable energy tenders (for wind and solar) in 2017 (in May and June) for 3 000 MW each.
Spain’s wind energy sector is eager to see the final version of the country’s National Energy and Climate Plan which will be approved by the European Commission very shortly. It will set new wind energy targets for 2030, and also the forthcoming law on climate change and energy transition that will establish the legal framework for achieving the plan’s targets for the next decade. The Spanish government’s draft energy climate plan sets a 42% renewable energy share target of final energy consumption by 2030. The new capacity target proposed for wind energy has risen to 50 258 MW.
Germany’s onshore wind energy market is faltering
In 2019, wind energy became the biggest energy source in the German electricity system by generating 126 TWh (110 TWh in 2018). In so doing, it relegated lignite to second place (114 TWh in 2019, 145.6 TWh in 2018). However, the wind sector’s current development context is causing its players concern as the newly-installed onshore wind capacity figure has plummeted. The German sector is suffering its worst growth for TWo decades.
Newly-installed onshore wind turbine capacity dropped below the one-GW threshold to 963 MW in 2019, according to data released in February by the German Energy Agency, Dena, (that coordinates the AGEEstat Working Group on Energy Statistics). If the decommissioned capacity is deducted (77 MW), net onshore capacity increased only by 886 MW (compared to 2 273 MW in 2018) taking the country’s total onshore wind turbine capacity to 53 333 MW.
The commissioning of the three offshore wind farms, mentioned above, took Germany’s overall additional capacity to about 2 GW (1 997 MW), and combined capacity to date to 60 840 MW (including 7 507 MW offshore). The German Wind Energy Association (BWE), partly ascribes the sharp drop in the number of onshore connections to the new regulatory requirements applicable to tenders, primarily the introduction of a minimum distance of 1000 meters for wind turbine siting from a residential district. These new constraints have a particularly strong impact, because many wind energy projects are led by medium-sized developers via “citizens’ projects”. The toughening of regulatory requirements has directly increased procedural delays. While a few years ago, operating licences could be granted within 10 months, nowadays the process takes more than TWo years. According to the BWE, there are more than 11 GW of projects awaiting authorisation. The other major curb is the rising number of legal actions taken by residents or environmental associations opposed to the installation of wind turbines.
Amendments to the renewable energy law were expected in 2019 to find solutions to the market slump, but at the end of the day, the decisions were only made in March 2020. Nonetheless, the situation is critical because the Government plans to raise the country’s renewable
The French market dwindles
According to the data published in the Panorama of renewable electricity, a publication produced jointly by industry players such as RTE, Enedis and the Renewable Energy Syndicate (SER), newly-connected capacity, after peaking in 2017 with 1 788 MW, dropped for the second year in a row (1 584 MW added in 2018 and 1 361 MW added in 2019). Thus, the turbine base grew by just 9% between 2018 and 2019 to 16 494 MW. As for output, the wind energy sector set a new record in 2019 put at 34.1 TWh (compared to 28.6 TWh of output in 2018, according to Eurostat). This growth can be ascribed to the rising load factor (put at 24.7% in 2019) and by the increase in installed capacity.
There were three auction rounds for onshore wind energy in 2019 (which were the third, fourth and fifth rounds since auctioning began), resulting in 21 projects for 516 MW for the 3rd round (average weighted price of € 63 per MWh), 20 projects for 576 MW for the fourth (average weighted price of € 66.5 per MWh). The 5th round closed on 3 January with 630 MW of capacity auctioned and a 6th round (from 1 June to 1 July 2020) will be for 752 MW of capacity. French offshore wind energy ambitions are now clearer. The third offshore wind auction round launched in December 2016, closed on 14 June 2019. It covers a wind farm off Dunkirk with 600 MW capacity, which should generate 2.3 TWh of electricity per annum starting in 2026. The successful bid came from the “Eoliennes en mer de Dunkerque” (EMD) consortium of EDF Renouvelables France SAS, Innogy SE and Blauracke GmbH, at an undisclosed strike price mooted at less than € 50 per MWh.
The Saint Nazaire wind farm, whose capacity is 500 MW, secured its funding in August 2019 and has embarked on its construction. It is France’s first offshore wind farm site to materialize. It should be gradually commissioned in phases by 2022. Consultations have also opened for the implementation of upcoming auctions for the Normandy offshore region. They will be held on an auction for 1 000 MW to be launched in the next few months and possibly other projects to be allocated from 2023 onwards. The debate, which started on 15 November 2019, will continue through to May 2020
|
Conquering shallow waters |
|
Europe has always been one step ahead in offshore wind power. This can also be claimed for the floating wind power segment. According to WindEurope’s latest tally, Europe already has a base of almost 45 MW, including Scotland’s Hywind Wind Farm (30 MW), the first (8.4 MW) of the three floating platforms that will make up Portugal’s Windfloat Atlantic Phase 1 wind farm, Norway’s prototype Hywind demo (2.3 MW), the Floatgen project off Croisic, France (2 MW), and Scotland’s Kincardine pilot project (2 MW). This capacity should rise significantly within the next three years with the installation of the first “pre-commercial” projects, with capacities ranging from 24 to 88 MW. Four are expected for France, Eolmed (24 MW) in 2021–2022, Provence Grand large (28.5 MW) in 2021, EFGL (30 MW) in 2022, and the floating wind turbines of Groix (28.5 MW) in 2020. Another is planned for Scotland, Kincardine (50 MW) in 2021, another for Norway in 2022, Hywind Tampen (88 MW), and the two other floating wind platforms of the WindFloat Atlantic Phase 1 project (i.e. 25 MW in total- in Portugal in 2020). These floating projects will be equipped with the latest-generation turbines identical to those of anchored offshore wind turbines, namely featuring unit capacities of 6.2 MW (6.2 M152 by Senvion), 8 MW (SG 8.0-167 DD, by Siemens Gamesa), 8.4 MW (V164-8.4 MW by MHI Vestas), 9.5 MW (V164-9.5 MW by MHI Vestas) and 10 MW (V164-10 MW by MHI Vestas). Currently France, which has long Atlantic and Mediterranean coastlines, is the most enterprising country. Under the terms of its National Energy and Climate Plan, which was submitted for consultation in January 2020, it intends to hold a first auction for 250 MW in 2021 and TWo auctions for 250 MW each in 2022, with respective target prices of € 120 per MWh and € 110 per MWh. The results of these tenders will determine the terms of the next rounds in 2024. |
the wind turbine industry redefines the boundaries
the double-digit Capacity machine era
While onshore wind energy will carry on playing a role primarily in landlocked countries, it is becoming clearer that offshore wind will become the flagship market. Its technology opens up the broadest horizons for the sector as it is unfettered by turbine size and capacity, offering huge improvements in load factors and even production.
In 2019, the MHI Vestas V164-8.4 MW was the highestcapacity wind turbine installed offshore, on the Belgian Norther and German Deutsche Bucht sites. Since 2019, it has also been the highest-capacity floating turbine installed on Portugal’s Windfloat Atlantic Phase 1 site. In 2020, this record will be broken when MHI Vestas 164- 9.5 MW wind turbines are installed on the Belgian Northwester 2 (219 MW) and Dutch Borssele 3&4 (731.5 MW) sites. The offshore segment has also entered the double-digit capacity wind turbine era, that redefines its load factor boundaries. Today’s highest-capacity wind turbine is currently being tested in the Port of Rotterdam. It is General Electric’s Haliade – X with 12 MW of capacity. It is 260 metres high (the Eiffel Tower is 324 metres high) and is equipped with a 220-metre rotor. General Electric says its load factor will be 63%.
Thus, each turbine will be able to generate electricity for 16 000 households, equating to gross annual output of 67 GWh in typical German North Sea site conditions. This turbine has already been specified by the offshore wind developer, Orsted, for its US sites of Skipjack (Maryland) (120 MW) planned to go on stream in 2022 and the Ocean Wind (1100 MW) project off the New Jersey coast planned to go on stream in 2024.
GE’s competitors have been very quick to respond. Siemens Gamesa Renewable Energy (SGRE) unveiled its first prototype nacelle for its latest model, the SG 193- 10 MW in November 2019. Commercial rollout is scheduled for 2022–2023, when they will be installed on the Hollandse Kust Zuid projects. Early in March 2020, Orsted also opted for the new Siemens Gamesa SG 11.0-200 DD turbine (11 MW for a 200-metre rotor) for its German wind farms of Borkum Riffgrund 3 (900 MW), scheduled to go on stream in 2024 and Gode Wind 3 (242 MW) schedule to start operating in 2025. In November 2019, MHI Vestas announced that it had clinched the contract for the floating wind turbine farm in the Gulf of Lion (EFGL) in the Mediterranean Sea, led by the Engie, EDPR, CDC, Eiffage, Principle Power consortium. This 30-MW pilot project could thus become the world’s first floating wind farm to be equipped with 10-MW wind turbines when it is installed in 2022, as it will use the V164-10 MW turbines. Turbine and generator designers are already working on the next generation of wind turbines with unit capacities that could be set to double. GreenSpur Wind Limited, for example, is currently fine-tuning the ORE Catapult – a new generation of generators of rare earth-free magnets in its test centre for wind turbines with a unit capacity of 20 MW. According to GreenSpur, these turbines could be ready “within three years”
the super project era
Every month sees new industrial and government announcements of the implementation of offshore wind super projects (at the scale of a Gigawatt). Likewise, the main countries involved in offshore wind are already working on identifying sites for the 2030s. These new targets can be explained by the very sharp price drops of the latest auctions and tenders. The results of the auctions announced in 2019, for wind farms that will be commissioned between 2023 and 2026 confirm this trend. In the UK, the offshore wind projects selected in the third allocation round for Contracts for Difference (CfD) posted strike prices that were 30% lower than those of the second auction that was held in 2017. Six projects were selected in all for 5 466 MW of combined capacity with strike prices ranging from £ 39.65 to £ 41.61 per MWh (about € 48 per MWh), expressed in 2010 prices.
The BEIS also reports that for the first time, renewable electricity prices will fall below market prices, which means consumers will save on their electricity bills. BEIS lists the six selected projects as Doggerbank Creyke Beck A Phase 1 for 1 200 MW, Doggerbank Creyke Beck B Phase 1 for 1 200 MW, Doggerbank Teeside A Phase 1 for 1 200 MW, Forthwind for 12 MW, Seagreen Phase 1 for 454 MW and Phase 1 of Sophia for 1 400 MW. These projects will go on stream between 2023 and 2025 and will supply 6.8 million British households. It should be remembered that in March 2019, the British government set a target when it launched an industrial plan through an agreement with its wind energy industry, that a third of British electricity should be produced by offshore wind energy by this timeline, equating to 30 GW of capacity.
In the Netherlands, the Hollande Kust Zuid 3 and 4 (760 MW) project, clinched by Vattenfall in July 2019 scheduled to come on stream in 2023 has been denied any guaranteed Feed-in Tariff or subsidies and will be paid at the market rate. Back in 2018, during earlier German and Dutch auctions, several wind farms successfully bid at zero price (€ 0 per MWh). A case in point is the Dutch project Hollandse Kust Zuid (700 MW) which is due to be commissioned in 2022.
In Germany, the OWP West (240 MW), Borkum Riffgrund West 1 (420 MW), Borkum Riffgrund West 2 (240 MW), EnBW He Dreiht (900 MW) projects planned to come on stream in 2024 and 2025, also successfully bid at € 0 per MWh. We should point out that certain, harder-to-access sites (deepwater sites) and areas that so far have seen little exploitation, still require higher guaranteed minimum prices, and the same applies to floating wind platforms (see inset).
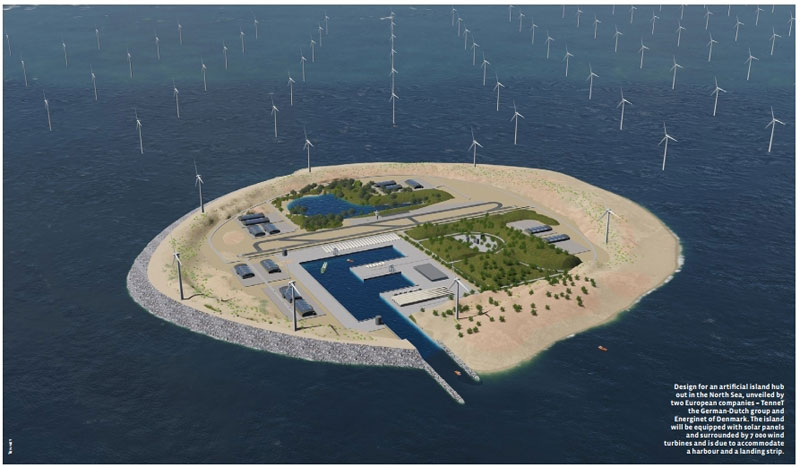
These price drops have also prompted some governments to raise their sights. Germany, for example, whose offshore wind target is 15 GW in 2030, already plans to raise this target to 20 GW as part of its climate protection programme adopted in October 2019. The BSH (Bundesamt für Seeschifffahrt), Germany’s offshore wind planning authority, is already identifying sites for after 2030, with plans (currently under consultation) to develop 35 GW of offshore wind energy projects in the North and Baltic Seas by 2035 and 40 GW by 2040. The North Sea Wind Power Hub project pitched for 2050 is even more ambitious and aims to create artificial islands in the middle of the North Sea, north-west of the end of the Dogger Bank. In March 2017, a consortium was set up to study the feasibility of this ambitious project by grid managers TenneT Netherlands, TenneT Germany and Energienet of Denmark, which were joined by Gasunie in September 2017 and the Port of Rotterdam in November 2017. According to TenneT, wind potential in the North Sea is put at between 70 and 150 GW in 2040 and more than 180 GW in 2045.
focus on other uses and storage
The Danish government plans to extend its offshore wind potential by creating artificial islands in order to increase the capacity of its offshore wind sector to 10 GW by 2030. Not only does it aim to achieve 100% renewable electricity but also develop technologies that will enable it to convert green electricity into hydrogen or hydrogen derivatives for aviation, naval fleets and industry. The Danish plan, announced in December 2019, provides for a 200–300 billion Danish krone investment (27–40 billion euros), that according to its Ministry of Energy and Climate, will be primarily funded by private investors. In a show of interest in non-electrical uses, the Shell petroleum group, the Dutch gas supplier Gasunie and the Port of Groningen revealed their plans for what could constitute the world’s biggest green hydrogen project in February 2020 – European Hydrogen Valley – also known as NortH2.
A project feasibility study envisages the construction of an offshore wind farm in the North Sea with 3–4 GW capacity devoted to producing hydrogen. The electrolysers will be located at Eemshaven, along the Netherlands’ northern coasts, and potentially installed offshore. The project is also contemplating an extension to 10 GW by 2040. These ambitions are driven by the Dutch Government’s desire to introduce a carbon tax, to cover the production of non-renewable hydrogen that could be levied at up to 125 euros per MWh per tonne of C02 from 2030 onwards. The NortH2 project could save 1 billion euros by 2040 by producing 800 000 tonnes of hydrogen.
Another interesting development is the growing desire for large-scale, long-term electricity storage solutions. SiemensGamesa is working on different methods, primarily the technique known as ETES (Electric Thermal Energy Storage). In June 2019 the German-Spanish company inaugurated its first demonstration project at Hamburg-Altenwerder with 130 MWh of storage capacity. The ETES technique uses electricity surpluses by transforming them into heat (by producing hot air, in a sort of giant hairdryer) and storing the heat in volcanic rocks. The hot air is blown into a thermally insulated enclosure (with 1-metre thick insulation) to heat the contents – 1 000 tonnes of crushed rocks – up to 600°C. This energy can then be restored as electricity by a steam turbine. The engineering company plans to construct from 2022 onwards (commissioning schedules for 2025) an initial pre-commercial facility with 1 GWh of storage capacity (this version will require 10 000 tonnes of volcanic rock), with 85 MW of loading capacity and 30 MW of unloading capacity.
The company aims very soon to propose commercial projects with a loading and unloading capacity of 100 MW. It aims to bring the storage system cost to 100 euros per kWh. It also envisages other advantages in its system such as the possibility of converting traditional gasand coal-fired power plants into storage units by using the turbines and steam generators without modification, and by filling their huge boilers with crushed volcanic rocks or even the possibility of using waste heat from energy-intensive industries that operate 24/7 such as steel-making.
300 Gw in 2030, or even more
After the end of this year, it will be time to name the countries that have invested sufficiently to achieve their 2020 renewable energy targets and the final share allocated to wind energy. It will not be letting the cat out of the bag if we say that wind technology will have made by far the highest contribution to the increase in renewably-sourced energy production over the past decade. Between 2010 and 2019 for the EU of 28, the figure is almost an additional 23.7 million tonnes oil equivalent (Mtoe) (an additional 275.8 TWh, of non-normalized output). At the scale of the European Union of 27 this figure is more than 19.1 Mtoe (an additional 222.7 TWh, nonnormalized output).
EurObserv’ER reckons that on the basis of installed wind capacity across the European Union of 28 (including the UK), the final result should be just below the shared target of the National Renewable Energy Action Plans (NREAPs). The new horizon defined for the next decade (2021–2030) is now that of the National Energy and Climate Plans (NECPs) that collectively aim to achieve the renewable energy target of a 32% share of gross final energy consumption. These plans have a wider aim than the NREAPs.
Their goal is to describe how the EU Member States intend to fulfil their renewable energy obligations, as well as their energy efficiency and GHG emission reduction obligations, the means employed for interconnection, research and innovation. During 2019, each Member State, submitted its draft plan (some later than others) to the European Commission for its recommendations. Publication of the final version of the NECPs has been a little slow in coming for a handful of countries, probably because of the latest political trade-offs made in the light of the European Commission’s recommendations. On 2 March 2020, the European Commission published the final National Energy and Climate Plans of 21 Member States on its website, leaving aside the UK. Six plans were still pending, including those of Germany, France, Spain, Romania, Ireland and Luxembourg.
While not all the NECPs are final, if all the documents (drafts and final versions) are compiled, they give some inkling into how the wind energy sector could evolve over the next decade. According to EurObserv’ER, if the best-case assumptions are taken when various energy scenarios are proposed (reinforced RES policies), wind capacity (onshore and offshore) could rise to about 300 GW in 2030 in the EU of 27 (without the UK). As for the UK, it has not clearly defined its wind targets for 2030. However, EurObserv’ER feels that if its wind energy-friendly policy is pursued, its capacity could be about 50 GW (including 30 GW offshore).
Given the development times taken to roll out wind energy projects, development of the NECPs can be considered as being well underway. This applies in particular to the offshore wind sector, as tendering and commissioning dates have already been scheduled for much of the coming decade. For instance, the Netherlands, under the terms of its NECP has programmed the installation pace of its offshore segment (auction and commissioning dates) through to 2030 (e.g.: auctions scheduled in 2025 for the Ijmuiden Ver, Kavel 3 and 4 projects each for 1 GW with commissioning planned for 2029–2030). The significant drop in expected production costs (below the market’s current prices) for the onshore and offshore wind energy segments makes longterm anticipation possible. It enables the country to take the decarbonization of its electricity in its stride, envisage greater input by renewable electricity to generating heat and refrigeration and make an early commitment to substituting other energy uses, such as “green” fuels for air and maritime transport and hydrogen production for industrial use.
However, it is still a little too soon to picture what weight the European wind energy sector will carry by 2030. Reassessment of the GHG emission reduction targets could lead to the implementation of an even more radical European energy policy being implemented on the climate issue. In a step in that direction, the European Commission presented its draft “Climate Law” on 4 March 2020, that proposes a legally binding target to bring down GHG emissions to zero by 2050. Thus, it is forecast that the EU’s and Member States’ institutions will be collectively bound to take the measures required to achieve this target, at their respective levels. It provides for the European Commission to harden the planned GHG emissions reduction target by 2030 (which is currently 40% less than the 1990 level). However, much to the distress of several environmental NGOs, the text has not set a new target. The draft climate law should be amended once the impact analysis of raising the targets is completed (result expected by September 2020).
This barometer was prepared by Observ’ER in the scope of the EurObserv’ER project, which groups together Observ’ER (FR), TNO
Energy Transition (NL), RENAC (DE), Frankfurt School of Finance and Management (DE), Fraunhofer ISI (DE) and Statistics Netherlands (NL). The information and views set out in this publication are those of the author(s) and do not necessarily reflect the official opinion of the Commission. The Commission does not guarantee the accuracy of the data included in this study. Neither the Commission nor any person acting on the Commission’s behalf may be held responsible for the use which may be made of the information contained therein.