Blue City Water Quality Index for 2018
by Ma Jun, Shen Sunan and Zhuge Haijin for the Institute of Public & Environmental Affairs - May 2019
Water quality is connected to public health, ecological balance, and social and economic development. In China, local ecology and environment departments and local water and natural resource departments provide the long-term monitoring of surface water and groundwater quality. They continue to expand and optimize their monitoring networks to improve overall management.

Preface
Water quality is connected to public health, ecological balance, and social and economic development. In China, local ecology and environment departments and local water and natural resource departments provide the long-term monitoring of surface water and groundwater quality. They continue to expand and optimize their monitoring networks to improve overall management.
In 2016, the number of water quality monitoring points across China increased from 967 to 2,767. In 2018, China constructed a national automatic monitoring network for surface waters and completed a national groundwater monitoring project, for which 10,169 specialized groundwater monitoring points were constructed to be monitored at the national government level. In 2017, the responsibilities for sampling and testing local water quality were separated such that third-party monitoring agencies now report testing results directly to the central government, rather than through city or provincial governments. This direct reporting system further guarantees the accuracy and authenticity of surface water monitoring data.
The transparency of water quality information is also gradually increasing. More cities actively and regularly disclose water quality data, and the scope of disclosures has expanded: local departments now publish data not only from monitoring points managed by the national government, but also from those managed by provincial, municipal and county-level governments. The content of these disclosures has also increased in detail, from general descriptions of local water quality conditions to the full disclosure of comprehensive monitoring data.
On May 7, for the first time, the Ministry of Ecology and Environment (MEE) published rankings for 30 of the best and worst performing cities according to the surface water quality monitoring results of 2,050 monitoring points managed by the national government. This new comparative system will undoubtedly motivate the transformation of China’s water management system, with the primary goals of improving water quality and accelerating national water and environmental protection.
The Institute of Public and Environmental Affairs (IPE) has collected water quality data issued by government departments across China since 2016, sorting and standardizing data that is then displayed on the Blue Map mobile app. The aggregate data illustrates changes in China’s environmental water quality. As the number of app users grows, more people are able to follow these trends. However, the original data may still be difficult for the public to understand due to its specialized nature.
In 2019, therefore, IPE developed the Blue City Water Quality Index (BCWQI) and scored 337 municipal cities and 25 counties on their overall water quality in 2018. The analysis is based on 600,000 water quality data points gathered the same year. The results produced the Blue City Water Quality Map, now available on the Blue Map app, which helps the public better understand regions with good water quality and those in need of improvement across the country.
Data Sources
- Surface Water
This data is primarily based on surface water quality monitoring data published in 2018 by ecology and environment bureaus at all levels of government.1It also refers to monitoring data published by local departments of water resources.
- Drinking Water Sources
This data is primarily based on 2018 monitoring data for centralized drinking water sources published by ecology and environment bureaus at the provincial, municipal and county level, combined with water source remediation progress reports.
Centralized drinking water sources (水源地) refer specifically to water bodies that support communities of 1,000 people or more in both urban and rural areas.
- Groundwater
This data is based on groundwater monitoring data disclosed by ecology and environment bureaus at all levels across the country, as well as groundwater quality status reports listed in the Water Pollution Prevention and Control Action Plan.2 It also refers to recent academic articles on urban groundwater research.
Score Breakdown
Surface water scores account for 50% of the total score, drinking water scores account for 30% and groundwater scores account for 20%. The distribution reflects the quality and availability of recent data, as well each water sources’ direct influence on the public.
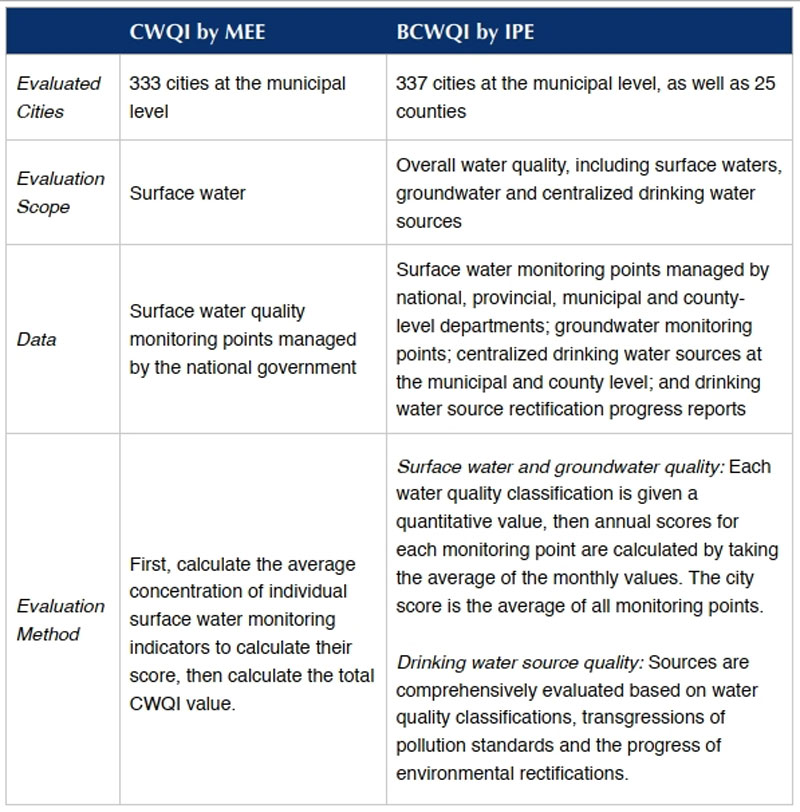
BCWQI (IPE) and CWQI (MEE) Evaluation Comparison
MEE national surface water quality rankings are based on the City Water Quality Index (CWQI). The difference between the Blue City Water Quality Index outlined in this report and the CWQI published by MEE may be understood as follows:
National Blue City Water Quality Map

The 2018 surface water, drinking water and groundwater quality of 337 municipal level cities and 25 counties are illustrated in the Blue City Water Quality Map.2 Regional colors represent different levels of water quality, from dark blue to dark purple, with dark blue representing the highest quality.
Excellent (dark blue): The total score (equivalent to the local water quality average) met or surpassed the requirements of Class II water quality, according to MEE environmental quality standards.4 Any problems with centralized drinking water sources were rectified.
Good (light blue and green): The total score (equivalent to the local water quality average) met or surpassed the requirements of Class III water quality. All water sources met the legal standards throughout the year and any environmental problems with centralized drinking water sources were rectified.
Moderate (yellow and dark yellow): The total score (equivalent to the local water quality average) met or surpassed the requirements of Class IV water quality. Water source pollutants exceeded legal standards once during the year and any environmental problems with centralized drinking water sources were rectified.
Relatively Poor (orange and orange-red): The total score (equivalent to the local water quality average) met or surpassed the requirements of Class V water quality. Water source pollutants exceeded legal standards three times during the year and not all environmental problems with centralized drinking water sources were rectified.
Poor (dark pink and purple): The total score (equivalent to the local water quality average) met or surpassed the requirements of Class V water quality. Water source pollutants exceeded legal standards more than three times throughout the year and not all environmental problems with centralized drinking water sources were rectified.
Overall Analysis
- Regions with the best water quality are primarily concentrated in the Qinghai-Tibet Plateau and its surrounding areas, especially in the first and second steps of China’s elevation above sea-level.
- Pollution levels in the plains are high. Water quality is relatively poor in the North China Plain, the Northeast China Plain, the middle and lower reaches of the Yangtze River and the Pearl River Delta.
- Water quality to the south of the Yangtze River is better than water quality to the north of the Yangtze River.

- Excellent overall water quality: 0.00-4.79 points, five cities in total
- Good overall water quality: 4.79-10.28 points, 85 cities in total
- Moderate overall water quality: 10.28-16.85 points, 133 cities in total
- Relatively poor overall water quality: 16.85-24.74 points, 97 cities in total
- Poor overall water quality” 24.74-50.00 points, 46 cities in total
Best National Water Quality
Table 1. 2018 Blue City Water Quality Index Top 30
|
Rank |
Province |
City |
Score |
Level |
|||
|
1 |
Qinghai |
Hainan |
4.04 |
Excellent |
|||
|
2 |
Sichuan |
Ganzi |
4.11 |
Excellent |
|||
|
3 |
Sichuan |
Aba |
4.42 |
Excellent |
|||
|
4 |
Qinghai |
Haibei |
4.58 |
Excellent |
|||
|
5 |
Qinghai |
Guoluo |
4.72 |
Excellent |
|||
|
6 |
Qinghai |
Yushu |
4.91 |
Good |
|||
|
7 |
Sichuan |
Guanyuan |
4.96 |
Good |
|||
|
8 |
Qinghai |
Huangnan |
5.26 |
Good |
|||
|
9 |
Xinjiang |
Tacheng |
5.62 |
Good |
|||
|
10 |
Sichuan |
Panzhihua |
5.75 |
Good |
|||
|
11 |
Hunan |
Zhangjiajie |
5.99 |
Good |
|||
|
12 |
Tibet |
Changdu |
6.14 |
Good |
|||
|
13 |
Xinjiang |
Bo’ertala |
6.19 |
Good |
|||
|
14 |
Xinjiang |
Yili |
6.28 |
Good |
|||
|
15 |
Gansu |
Jiayuguan |
6.66 |
Good |
|||
|
16 |
Sichuan |
Liangshan |
6.71 |
Good |
|||
|
17 |
Guizhou |
Qiandongnan |
6.74 |
Good |
|||
|
18 |
Xinjiang |
Akesu |
6.85 |
Good |
|||
|
19 |
Xinjiang |
Changji |
6.93 |
Good |
|||
|
20 |
Tibet |
Ali |
7.05 |
Good |
|||
|
21 |
Sichuan |
Bazhong |
7.20 |
Good |
|||
|
22 |
Hunan |
Chenzhou |
7.20 |
Good |
|||
|
23 |
Tibet |
Linzhi |
7.21 |
Good |
|||
|
24 |
Gansu |
Jinchang |
7.21 |
Good |
|||
|
25 |
Guangdong |
Shaoguan |
7.23 |
Good |
|||
|
26 |
Zhejiang |
Zhoushan |
7.28 |
Good |
|||
|
27 |
Jiangxi |
Shangrao |
7.28 |
Good |
|||
|
28 |
Gansu |
Jiuquan |
7.29 |
Good |
|||
|
29 |
Guangdong |
Yunfu |
7.36 |
Good |
|||
|
30 |
Guizhou |
Anshun |
7.46 |
Good |
|||
Lowest National Water Quality
Table 2. 2018 Blue City Water Quality Index Bottom 30
|
Rank |
Province |
City |
Score |
Level |
|
|
1 |
Shanxi |
Yangquan |
41.92 |
Poor |
|
|
2 |
Inner Mongolia |
Tongliao |
40.81 |
Poor |
|
|
3 |
Guangdong |
Shenzhen |
39.42 |
Poor |
|
|
4 |
Hebei |
Hengshui |
38.54 |
Poor |
|
|
5 |
Heilongjiang |
Suihua |
37.44 |
Poor |
|
|
6 |
Inner Mongolia |
Hulunbei’er |
35.93 |
Poor |
|
|
7 |
Jilin |
Siping |
34.59 |
Poor |
|
|
8 |
Liaoning |
Anshan |
34.43 |
Poor |
|
|
9 |
Shandong |
Rizhao |
32.91 |
Poor |
|
|
10 |
Hebei |
Cangzhou |
32.75 |
Poor |
|
|
11 |
Jilin |
Changchun |
32.42 |
Poor |
|
|
12 |
Inner Mongolia |
Wulanchabu |
32.39 |
Poor |
|
|
13 |
Liaoning |
Yingkou |
31.50 |
Relatively Poor |
|
|
14 |
Guangdong |
Guangzhou |
31.15 |
Relatively Poor |
|
|
15 |
Heilongjiang |
Jiamusi |
30.99 |
Relatively Poor |
|
|
16 |
Hebei |
Langfang |
29.97 |
Relatively Poor |
|
|
17 |
Shaanxi |
Tongchuan |
29.86 |
Relatively Poor |
|
|
18 |
Guangdong |
Dongguan |
29.42 |
Relatively Poor |
|
|
19 |
Ningxia |
Wuzhong |
28.90 |
Relatively Poor |
|
|
20 |
Liaoning |
Shenyang |
28.57 |
Relatively Poor |
|
|
21 |
Shandong |
Liaocheng |
28.25 |
Relatively Poor |
|
|
22 |
Shandong |
Heze |
27.93 |
Relatively Poor |
|
|
23 |
Shaanxi |
Weinan |
27.90 |
Relatively Poor |
|
|
24 |
Shandong |
Binzhou |
27.66 |
Relatively Poor |
|
|
25 |
Guangdong |
Huizhou |
27.65 |
Relatively Poor |
|
|
26 |
Hebei |
Xingtai |
27.60 |
Relatively Poor |
|
|
27 |
Shandong |
Dezhou |
27.03 |
Relatively Poor |
|
|
28 |
Shandong |
Weifang |
26.83 |
Relatively Poor |
|
|
29 |
Shanxi |
Datong |
26.47 |
Relatively Poor |
|
|
30 |
Shanxi |
Taiyuan |
26.44 |
Relatively Poor |
|

According to the average BCWQI scores of provincial jurisdictions, the worst water quality is in Tianjin, Shanxi and Hebei, and the best is in Qinghai, Tibet and Guizhou.
National Surface Water Quality Map

Surface Water Quality Levels
- Excellent (dark blue): The average local surface water quality met or surpassed the requirements of Class II water quality.
- Good (light blue and green): The average local surface water quality achieved Class III water quality.
- General (yellow and dark yellow): The average local surface water quality achieved Class IV water quality.
- Relatively Poor (orange and orange-red): The average local surface water quality achieved Class V water quality.
- Poor (dark pink and purple): The average local surface water quality did not achieve Class V water quality.
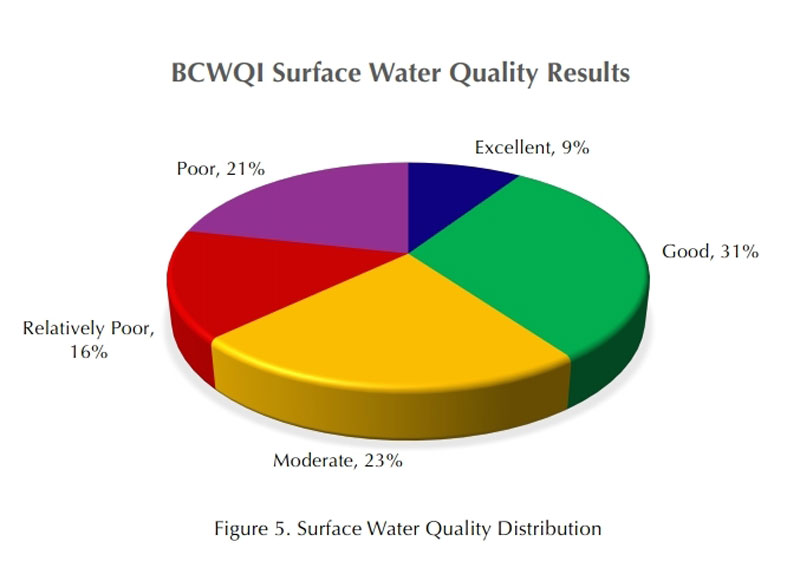
Cities with excellent or good surface water quality comprised 40% of all cities this year, while 21% of cities comprised the lowest rankings.
Table 3. 2018 Top 30 Cities of the National Surface Water Index
|
Rank Province |
City |
Score |
Level |
|||
|
1 |
Qinghai |
Yushu |
2.96 |
Excellent |
||
|
2 |
Hunan |
Zhangjiajie |
3.32 |
Excellent |
||
|
3 |
Liaoning |
Dandong |
3.37 |
Excellent |
||
|
4 |
Qinghai |
Hainan |
3.41 |
Excellent |
||
|
5 |
Xinjiang |
Bayinguoleng |
3.60 |
Excellent |
||
|
6 |
Xinjiang |
Kashen |
3.60 |
Excellent |
||
|
7 |
Sichuan |
Panzhihua |
3.77 |
Excellent |
||
|
8 |
Yunnan |
Xishuangbanna |
3.79 |
Excellent |
||
|
9 |
Guizhou |
Anshun |
3.81 |
Excellent |
||
|
10 |
Qinghai |
Guoluo |
3.83 |
Excellent |
||
|
11 |
Guangdong |
Yunfu |
3.83 |
Excellent |
||
|
12 |
Yunnan |
Diqing |
3.85 |
Excellent |
||
|
13 |
Gansu |
Jiuquan |
3.93 |
Excellent |
||
|
14 |
Qinghai |
Haibei |
3.98 |
Excellent |
||
|
15 |
Sichuan |
Guangyuan |
4.05 |
Excellent |
||
|
16 |
Sichuan |
Ganzi |
4.24 |
Excellent |
||
|
17 |
Shaanxi |
Shangluo |
4.30 |
Excellent |
||
|
18 |
Guizhou |
Qiandongnan |
4.31 |
Excellent |
||
|
19 |
Gansu |
Longnan |
4.32 |
Excellent |
||
|
20 |
Xinjiang |
Tulufan |
4.36 |
Excellent |
||
|
21 |
Xinjiang |
Changji |
4.43 |
Excellent |
||
|
22 |
Sichuan |
Aba |
4.55 |
Excellent |
||
|
23 |
Tibet |
Changdu |
4.75 |
Excellent |
||
|
24 |
Xinjiang |
Yili |
4.76 |
Excellent |
||
|
25 |
Shaanxi |
Ankang |
4.79 |
Excellent |
||
|
26 |
Xinjiang |
Wulumuqi |
4.80 |
Excellent |
||
|
27 |
Zhejiang |
Lishui |
4.82 |
Excellent |
||
|
28 |
Shaanxi |
Hanzhong |
4.84 |
Excellent |
||
|
29 |
Xinjiang |
Akesu |
4.95 |
Excellent |
||
|
30 |
Gansu |
Jiayuguan |
4.95 |
Excellent |
||
Table 4. 2018 Bottom 30 Cities of the National Surface Water Index
|
Rank Province |
City |
Score |
Level |
|
|
1 |
Guangdong |
Shenzhen |
53.41 |
Poor |
|
2 |
Jilin |
Siping |
42.99 |
Poor |
|
3 |
Inner Mongolia |
Wulanchabu |
42.71 |
Poor |
|
4 |
Shandong |
Rizhao |
40.54 |
Poor |
|
5 |
Guangdong |
Guangzhou |
39.12 |
Poor |
|
6 |
Hebei |
Hengshui |
37.92 |
Poor |
|
7 |
Shaanxi |
Tongchuan |
35.83 |
Poor |
|
8 |
Liaoning |
Anshan |
35.79 |
Poor |
|
9 |
Jilin |
Changchun |
35.71 |
Poor |
|
10 |
Liaoning |
Shenyang |
35.24 |
Poor |
|
11 |
Shanxi |
Yangquan |
33.47 |
Poor |
|
12 |
Inner Mongolia |
Tongliao |
32.97 |
Poor |
|
13 |
Hebei |
Xingtai |
32.69 |
Poor |
|
14 |
Guangdong |
Huizhou |
32.65 |
Poor |
|
15 |
Guangdong |
Dongguan |
32.65 |
Poor |
|
16 |
Shanxi |
Datong |
32.47 |
Poor |
|
17 |
Shandong |
Liaocheng |
32.31 |
Poor |
|
18 |
Hebei |
Langfang |
31.88 |
Poor |
|
19 |
Hebei |
Cangzhou |
30.67 |
Poor |
|
20 |
Liaoning |
Yingkou |
30.02 |
Poor |
|
21 |
Ningxia |
Wuzhong |
28.83 |
Poor |
|
22 |
Shandong |
Dezhou |
28.51 |
Poor |
|
23 |
Hainan |
Sanya |
28.48 |
Poor |
|
24 |
Jiangsu |
Yangzhou |
27.96 |
Poor |
|
25 |
Liaoning |
Panjin |
27.79 |
Poor |
|
26 |
Shanxi |
Taiyuan |
27.46 |
Poor |
|
27 |
Shanxi |
Yuncheng |
27.15 |
Poor |
|
28 |
Shanxi |
Luliang |
27.04 |
Poor |
|
29 |
Guangdong |
Shantou |
26.84 |
Poor |
|
30 |
Shandong |
Weifang |
26.84 |
Poor |
Surface Water Quality Analysis
Since the Action Plan for the Prevention and Control of Water Pollution was issued in 2015, China has implemented rigorous water pollution control and national surface water quality has improved each year. In 2018, among the 1,935 surface water quality monitoring points managed at the national level, locations that achieved Class I to Class III water quality comprised 71% of all monitoring points, up 3.1% from 2017. The proportion of Class V poor water quality points fell to 6.7%, down 1.6% from 2017.5
In contrast, however, comprehensive data including 9,514 national and non-statecontrolled surface water quality data points collected in the Blue Map Database in 2018 indicate that monitoring points that achieved Class I to Class III water quality comprise only 51.6% of all monitors, while Class V monitors account for 15.2% of the total. It follows that water quality in non-state-controlled areas (mainly in shorter and smaller tributaries and lakes) may be generally inferior to state-controlled sections.
National Drinking Water Quality Map
The water quality index calculations also include 3,708 centralized drinking water sources monitored at the municipal and county level.

Drinking Water Source Quality Levels
Excellent (dark blue): The total score (equivalent to the local water quality average) met or surpassed the requirements of Class II water quality and all environmental problems have been rectified.
Good (light blue and green): The total score (equivalent to the local water quality average) meets all legal standards and all environmental problems have been rectified.
General (yellow and dark yellow): The total score (equivalent to the local water quality average) exceeded pollutant standards once during the year and all environmental problems have been rectified.
Poor (orange and orange-red): The total score (equivalent to the local water quality average) exceeded pollutant standards three times throughout the year, and at least 50% but less than 100% of environmental problems have been rectified.
Poor (dark pink and purple): The total score (equivalent to the local water quality average) exceeded pollutant standards four or more times throughout the year, and less than 50% of environmental problems have been rectified.

Table 5. 2018 Top 30 Cities of the National Drinking Water Quality Index
|
Rank |
Province |
City |
Score |
Level |
|
1 |
Tibet |
Changdu |
0.57 |
Excellent |
|
2 |
Xinjiang |
Tacheng |
1.00 |
Excellent |
|
2 |
Tibet |
Ali |
1.00 |
Excellent |
|
2 |
Tibet |
Linzhi |
1.00 |
Excellent |
|
5 |
Hunan |
Zhangjiajie |
1.57 |
Excellent |
|
6 |
Gansu |
Jiayuguan |
1.87 |
Excellent |
|
7 |
Sichuan |
Aba |
1.92 |
Excellent |
|
8 |
Xinjiang |
Bayinguoleng |
1.93 |
Excellent |
|
9 |
Qinghai |
Haibei |
1.98 |
Excellent |
|
10 |
Qinghai |
Huangnan |
2.11 |
Excellent |
|
11 |
Gansu |
Linxia |
2.20 |
Excellent |
|
12 |
Guangdong |
Yunfu |
2.32 |
Excellent |
|
13 |
Yunnan |
Xishuangbanna |
2.34 |
Excellent |
|
14 |
Sichuan |
Ganzi |
2.36 |
Excellent |
|
15 |
Qinghai |
Guoluo |
2.43 |
Excellent |
|
16 |
Sichuan |
Guangyuan |
2.44 |
Excellent |
|
17 |
Yunnan |
Nujiang |
2.51 |
Excellent |
|
18 |
Gansu |
Jinchang |
2.69 |
Excellent |
|
19 |
Sichuan |
Panzhihua |
2.93 |
Excellent |
|
20 |
Xinjiang |
Yili |
2.96 |
Excellent |
|
21 |
Qinghai |
Hainan |
3.03 |
Excellent |
|
22 |
Xinjiang |
Akesu |
3.18 |
Excellent |
|
23 |
Yunnan |
Lijiang |
3.18 |
Excellent |
|
24 |
Xinjiang |
Bo’ertala |
3.32 |
Excellent |
|
25 |
Guizhou |
Qiandongnan |
3.49 |
Excellent |
|
26 |
Guangdong |
Meizhou |
3.60 |
Excellent |
|
27 |
Xinjiang |
Changji |
3.93 |
Excellent |
|
28 |
Gansu |
Gannan |
4.02 |
Excellent |
|
29 |
Zhejiang |
Lishui |
4.10 |
Excellent |
|
30 |
Xinjiang |
Wulumuqi |
4.21 |
Excellent |
Table 6. 2018 Bottom 30 Cities of the National Drinking Water Quality Index
|
Rank |
Province |
City |
Score |
Level |
|
1 |
Heilongjiang |
Jiamusi |
50.00 |
Poor |
|
1 |
Inner Mongolia |
Hulunbei’er |
50.00 |
Poor |
|
1 |
Heilongjiang |
Suihua |
50.00 |
Poor |
|
1 |
Shanxi |
Yangquan |
50.00 |
Poor |
|
5 |
Inner Mongolia |
Tongliao |
47.33 |
Poor |
|
6 |
Anhui |
Bozhou |
35.32 |
Poor |
|
7 |
Liaoning |
Huludao |
34.19 |
Poor |
|
8 |
Jilin |
Jilin |
30.03 |
Poor |
|
9 |
Heilongjiang |
Daqing |
29.36 |
Poor |
|
10 |
Shandong |
Zaozhuang |
27.55 |
Poor |
|
11 |
Inner Mongolia |
Xilinguolei |
26.74 |
Poor |
|
12 |
Heilongjiang |
Qiqiha’er |
26.26 |
Poor |
|
13 |
Ningxia |
Wuzhong |
23.96 |
Poor |
|
14 |
Ningxia |
Guyuan |
22.49 |
Poor |
|
15 |
Hebei |
Hengshui |
21.65 |
Relatively Poor |
|
16 |
Anhui |
Suzhou |
21.30 |
Relatively Poor |
|
17 |
Liaoning |
Liaoyang |
21.07 |
Relatively Poor |
|
18 |
Heilongjiang |
Qitaihe |
20.93 |
Relatively Poor |
|
19 |
Liaoning |
Fushun |
19.98 |
Relatively Poor |
|
20 |
Heilongjiang |
Heihe |
19.89 |
Relatively Poor |
|
21 |
Jiangxi |
Xinyu |
19.70 |
Relatively Poor |
|
22 |
Zhejiang |
Jiaxing |
18.56 |
Relatively Poor |
|
23 |
Qinghai |
Haixi |
17.31 |
Relatively Poor |
|
24 |
Anhui |
Huainan |
16.04 |
Relatively Poor |
|
25 |
Guangdong |
Dongguan |
15.82 |
Relatively Poor |
|
26 |
Xinjiang |
Kashen |
15.81 |
Relatively Poor |
|
27 |
Guangxi |
Laibin |
15.62 |
Relatively Poor |
|
28 |
Heilongjiang |
Mudanjiang |
15.62 |
Relatively Poor |
|
29 |
Shanxi |
Linfen |
15.52 |
Relatively Poor |
|
30 |
Shandong |
Jining |
15.28 |
Relatively Poor |
Drinking Water Quality Analysis
The BCWQI scores of drinking water sources comprehensively examine their water quality classification, the number of times they exceeded pollutant standards, and if they received any environmental remediation.
Judging from the general compliance of drinking water sources, the annual water quality compliance rate of centralized drinking water sources at the county level or above in 2018 (referring to all monitoring up to the standard in 2018) was 91.79%. Some water sources have not completely rectified their environmental problems or have not released the overall improvement in time, which has affected their scores.

The groundwater quality in the Northeast, Northwest, North and Central regions of China was relatively poor.


Groundwater Quality Analysis
China’s Report on the State of the Environment began disclosing groundwater conditions in 2009. The first publication included only results from only 641 monitoring points in eight provinces. In 2018, however, the report included statistical results from 10,168 monitoring points, demonstrating the gradual improvement of information disclosure and the government’s present emphasis on groundwater quality issues. According to China’s Report on the State of the Environment over the years, groundwater quality in the country shows a deteriorating trend. Monitoring points classified as Good or Excellent have declined in both quantity and proportion, while those with Poor or Relatively Poor water quality have increased year by year.
Due to the complex nature of groundwater pollution and the influence of natural environmental factors, most groundwater monitoring projects with pollution above the legal standard may simply have high mineral content near the bottom of the water body. However, some human influence may be seen in indicators such as ammonia nitrogen, which are already deemed major water pollutants alongside iron and manganese, evidencing how manmade pollution has spread to China’s groundwaters.
Because most cities have not developed disclosure systems for groundwater quality information, the groundwater quality map for 2018 involved a comprehensive analysis of official information published over the years, relevant data from academic research, and information for which IPE applied and obtained from multiple management departments. The data from these sources may vary by record year, the depth at which monitors were placed within the groundwater, and the type of groundwater.
Due to the fact that existing groundwater data must be gathered from multiple sources with various record years, depths of monitoring points, and types of groundwater, this first edition of the BCWQI is far from complete. However, as the first map to display groundwater quality for every city, we hope that it can help the public understand the severe status of groundwater pollution and encourage the improvement of groundwater quality monitoring and disclosure platforms.
Appendix: 2018 Blue City Water Quality Index Ranking
|
Rank Province City Score Level |
|
Rank Province City Score Level |
||||||||
|
1 |
Qinghai |
Hainan |
4.04 |
Excellent |
41 |
Sichuan |
Leshan |
8.00 |
Good |
|
|
2 |
Sichuan |
Ganzi |
4.11 |
Excellent |
42 |
Gansu |
Linxia |
8.07 |
Good |
|
|
3 |
Sichuan |
Aba |
4.42 |
Excellent |
43 |
Hubei |
Shennongjia |
8.12 |
Good |
|
|
4 |
Qinghai |
Haibei |
4.58 |
Excellent |
44 |
Yunnan |
Baoshan |
8.14 |
Good |
|
|
5 |
Qinghai |
Guoluo |
4.73 |
Excellent |
45 |
Yunnan |
Dehong |
8.18 |
Good |
|
|
6 |
Qinghai |
Yushu |
4.91 |
Good |
46 |
Guangdong |
Meizhou |
8.19 |
Good |
|
|
7 |
Sichuan |
Guangyuan |
4.96 |
Good |
47 |
Tibet |
Naqu |
8.26 |
Good |
|
|
8 |
Qinghai |
Huangnan |
5.26 |
Good |
48 |
Yunnan |
Zhaotong |
8.26 |
Good |
|
|
9 |
Xinjiang |
Tacheng |
5.62 |
Good |
49 |
Jiangxi |
Jingdezhen |
8.26 |
Good |
|
|
10 |
Sichuan |
Panzhihua |
5.75 |
Good |
50 |
Guizhou |
Bijie |
8.37 |
Good |
|
|
11 |
Hunan |
Zhangjiajie |
5.99 |
Good |
51 |
Hunan |
Xiangxi |
8.44 |
Good |
|
|
12 |
Tibet |
Changdu |
6.14 |
Good |
52 |
Zhejiang |
Lishui |
8.46 |
Good |
|
|
13 |
Xinjiang |
Bo’ertala |
6.19 |
Good |
53 |
Tibet |
Lasa |
8.54 |
Good |
|
|
14 |
Xinjiang |
Yili |
6.28 |
Good |
54 |
Sichuan |
Nanchong |
8.67 |
Good |
|
|
15 |
Gansu |
Jiayuguan |
6.66 |
Good |
55 |
Yunnan |
Diqing |
8.67 |
Good |
|
|
16 |
Sichuan |
Liangshan |
6.72 |
Good |
56 |
Shaanxi |
Shangluo |
8.69 |
Good |
|
|
17 |
Guizhou |
Qiandongnan |
6.74 |
Good |
57 |
Guizhou |
Qiannan |
8.74 |
Good |
|
|
18 |
Xinjiang |
Akesu |
6.85 |
Good |
58 |
Tibet |
Shannan |
8.78 |
Good |
|
|
19 |
Xinjiang |
Changji |
6.93 |
Good |
59 |
Sichuan |
Yibin |
8.78 |
Good |
|
|
20 |
Tibet |
Ali |
7.05 |
Good |
60 |
Tibet |
Rikaze |
8.94 |
Good |
|
|
21 |
Sichuan |
Bazhong |
7.20 |
Good |
61 |
Guizhou |
Tongren |
8.96 |
Good |
|
|
22 |
Hunan |
Chenzhou |
7.20 |
Good |
62 |
Liaoning |
Dandong |
8.97 |
Good |
|
|
23 |
Tibet |
Linzhi |
7.21 |
Good |
63 |
Yunnan |
Pu'er |
9.07 |
Good |
|
|
24 |
Gansu |
Jinchang |
7.21 |
Good |
64 |
Jiangxi |
Yingtan |
9.08 |
Good |
|
|
25 |
Guangdong |
Shaoguan |
7.23 |
Good |
65 |
Fujian |
Nanping |
9.27 |
Good |
|
|
26 |
Zhejiang |
Zhoushan |
7.28 |
Good |
66 |
Guizhou |
Qianxinan |
9.31 |
Good |
|
|
27 |
Jiangxi |
Shangrao |
7.29 |
Good |
67 |
Hunan |
Huaihua |
9.52 |
Good |
|
|
28 |
Gansu |
Jiuquan |
7.29 |
Good |
68 |
Sichuan |
Guang'an |
9.53 |
Good |
|
|
29 |
Guangdong |
Yunfu |
7.36 |
Good |
69 |
Fujian |
Xiamen |
9.55 |
Good |
|
|
30 |
Guizhou |
Anshun |
7.47 |
Good |
70 |
Zhejiang |
Quzhou |
9.57 |
Good |
|
|
31 |
Zhejiang |
Jinhua |
7.48 |
Good |
71 |
Hunan |
Xiangtan |
9.69 |
Good |
|
|
32 |
Yunnan |
Nujiang |
7.51 |
Good |
72 |
Hunan |
Loudi |
9.76 |
Good |
|
|
33 |
Yunnan |
Lijiang |
7.57 |
Good |
73 |
Qinghai |
Xining |
9.83 |
Good |
|
|
34 |
Gansu |
Longnan |
7.59 |
Good |
74 |
Xinjiang |
Wulumuqi |
9.83 |
Good |
|
|
35 |
Gansu |
Gannan |
7.60 |
Good |
75 |
Xinjiang |
Tumushuke |
9.87 |
Good |
|
|
36 |
Shaanxi |
Hanzhong |
7.81 |
Good |
76 |
Guangxi |
Chongzuo |
9.97 |
Good |
|
|
37 |
Sichuan |
Mianyang |
7.81 |
Good |
77 |
Guizhou |
Zunyi |
10.01 |
Good |
|
|
38 |
Sichuan |
Ya’an |
7.82 |
Good |
78 |
Hubei |
Xianning |
10.02 |
Good |
|
|
39 |
Yunnan |
Xishuangbanna |
7.87 |
Good |
79 |
Jiangxi |
Ji'an |
10.02 |
Good |
|
| 40 | Yunnan Lincang | 7.96 | Good | 80 | Xinjiang | Tulufan | 10.10 | Good | ||
|
Rank Province City Score Level |
|
Rank Province City Score Level |
||||||||
|
81 |
Jiangxi |
Jiujiang |
10.12 |
Good |
123 |
Xinjiang |
Hetian |
11.65 |
Moderate |
|
|
82 |
Sichuan |
Deyang |
10.14 |
Good |
124 |
Xinjiang |
Hami |
11.78 |
Moderate |
|
|
83 |
Guangxi |
Guilin |
10.15 |
Good |
125 |
Guangdong |
Shanwei |
11.81 |
Moderate |
|
|
84 |
Jiangxi |
Yichun |
10.18 |
Good |
126 |
Guangxi |
Guigang |
11.83 |
Moderate |
|
|
85 |
Anhui |
Xuancheng |
10.19 |
Good |
127 |
Hubei |
Xiantao |
11.86 |
Moderate |
|
|
86 |
Hunan |
Yueyang |
10.21 |
Good |
128 |
Inner Mongolia |
Alashan |
11.89 |
Moderate |
|
|
87 |
Hubei |
Shiyan |
10.22 |
Good |
||||||
|
88 |
Guangxi |
Wuzhou |
10.22 |
Good |
129 |
Guangxi |
Nanning |
11.89 |
Moderate |
|
|
89 |
Yunnan |
Qujing |
10.23 |
Good |
130 |
Anhui |
Chuzhou |
11.93 |
Moderate |
|
|
90 |
Hunan |
Yongzhou |
10.23 |
Good |
131 |
Henan |
Sanmenxia |
11.99 |
Moderate |
|
|
91 |
Inner Mongolia |
Xing'anmeng |
10.52 |
Moderate |
132 |
Guangdong |
Heyuan |
12.01 |
Moderate |
|
|
133 |
Anhui |
Tongling |
12.08 |
Moderate |
||||||
|
92 |
Hunan |
Zhuzhou |
10.55 |
Moderate |
134 |
Hunan |
Changsha |
12.11 |
Moderate |
|
|
93 |
Gansu |
Dingxi |
10.59 |
Moderate |
135 |
Jiangxi |
Ganzhou |
12.20 |
Moderate |
|
|
94 |
Qinghai |
Haidong |
10.62 |
Moderate |
136 |
Guangxi |
Hechi |
12.20 |
Moderate |
|
|
95 |
Jiangxi |
Pingxiang |
10.65 |
Moderate |
137 |
Henan |
Nanyang |
12.22 |
Moderate |
|
|
96 |
Hunan |
Shaoyang |
10.70 |
Moderate |
138 |
Guangdong |
Zhuhai |
12.26 |
Moderate |
|
|
97 |
Guangxi |
Fangchenggang |
10.71 |
Moderate |
139 |
Fujian |
Longyan |
12.30 |
Moderate |
|
|
98 |
Xinjiang |
Kelamayi |
10.72 |
Moderate |
140 |
Guangdong |
Yangjiang |
12.34 |
Moderate |
|
|
99 |
Jiangxi |
Fuzhou |
10.74 |
Moderate |
141 |
Hebei |
Chengde |
12.36 |
Moderate |
|
|
100 |
Xinjiang |
Ala’er |
10.74 |
Moderate |
142 |
Guangdong |
Zhanjiang |
12.39 |
Moderate |
|
|
101 |
Heilongjiang |
Daxing’anling |
10.75 |
Moderate |
143 |
Anhui |
Liu'an |
12.41 |
Moderate |
|
|
102 |
Shaanxi |
Baoji |
10.77 |
Moderate |
144 |
Shanxi |
Changzhi |
12.57 |
Moderate |
|
|
103 |
Ningxia |
Shizuishan |
10.80 |
Moderate |
145 |
Gansu |
Zhangye |
12.65 |
Moderate |
|
|
104 |
Hubei |
Enshi |
10.89 |
Moderate |
146 |
Zhejiang |
Shaoxing |
12.66 |
Moderate |
|
|
105 |
Anhui |
Huangshan |
10.89 |
Moderate |
147 |
Heilongjiang |
Hegang |
12.66 |
Moderate |
|
|
106 |
Gansu |
Wuwei |
10.94 |
Moderate |
148 |
Jilin |
Yanbian |
12.67 |
Moderate |
|
|
107 |
Jilin |
Baishan |
10.95 |
Moderate |
149 |
Sichuan |
Luzhou |
12.71 |
Moderate |
|
|
108 |
Yunnan |
Chuxiong |
10.95 |
Moderate |
150 |
Guangdong |
Qingyuan |
12.71 |
Moderate |
|
|
109 |
Hunan |
Changde |
10.95 |
Moderate |
151 |
Hubei |
Suizhou |
12.75 |
Moderate |
|
|
110 |
Yunnan |
Wenshan |
10.95 |
Moderate |
152 |
Hainan |
Wuzhishan |
12.77 |
Moderate |
|
|
111 |
Fujian |
Sanming |
10.96 |
Moderate |
153 |
Hubei |
Huanggang |
12.81 |
Moderate |
|
|
112 |
Guangdong |
Zhaoqing |
10.96 |
Moderate |
154 |
Xinjiang |
Bayin’guoleng |
12.83 |
Moderate |
|
|
113 |
Shaanxi |
Ankang |
11.08 |
Moderate |
155 |
Zhejiang |
Taizhou |
12.89 |
Moderate |
|
|
114 |
Hunan |
Hengyang |
11.09 |
Moderate |
156 |
Shandong |
Linyi |
12.97 |
Moderate |
|
|
115 |
Sichuan |
Dazhou |
11.20 |
Moderate |
157 |
Inner Mongolia |
Wuhai |
13.00 |
Moderate |
|
|
116 |
Hubei |
Xiangyang |
11.23 |
Moderate |
||||||
|
117 |
Qinghai |
Haixi |
11.24 |
Moderate |
158 |
Shanxi |
Zhangzhou |
13.01 |
Moderate |
|
|
118 |
Fujian |
Ningde |
11.33 |
Moderate |
159 |
Hunan |
Yiyang |
13.09 |
Moderate |
|
|
119 |
Xinjiang |
Wujiaqu |
11.36 |
Moderate |
160 |
Henan |
Pingdingshan |
13.10 |
Moderate |
|
|
120 |
Guizhou |
Liupanshui |
11.39 |
Moderate |
161 |
Guangxi |
Laibin |
13.19 |
Moderate |
|
|
121 |
Sichuan |
Suining |
11.41 |
Moderate |
162 |
Shaanxi |
Xianyang |
13.20 |
Moderate |
|
|
122 |
Jiangsu Huai'an 11.51 Moderate |
163 |
Fujian |
Fuzhou |
13.42 |
Moderate |
||||
|
Rank Province City Score Level |
|
Rank Province City Score Level |
||||||||
|
164 |
Jiangsu |
Suqian |
13.53 |
Moderate |
207 |
Heilongjiang |
Jixi |
15.81 |
Moderate |
|
|
165 |
Jilin |
Tonghua |
13.60 |
Moderate |
208 |
Inner Mongolia |
Bayannao’er |
15.83 |
Moderate |
|
|
166 |
Hebei |
Zhangjiakou |
13.64 |
Moderate |
||||||
|
167 |
Shandong |
Tai’an |
13.74 |
Moderate |
209 |
Liaoning |
Benxi |
15.92 |
Moderate |
|
|
168 |
Fujian |
Quanzhou |
13.76 |
Moderate |
210 |
Hainan |
Dongfang |
16.10 |
Moderate |
|
|
169 |
Anhui |
Wuhu |
13.78 |
Moderate |
211 |
Anhui |
Huainan |
16.21 |
Moderate |
|
|
170 |
Hubei |
Yichang |
13.80 |
Moderate |
212 |
Hebei |
Qinhuangdao |
16.21 |
Moderate |
|
|
171 |
Jiangsu |
Xuzhou |
13.81 |
Moderate |
213 |
Jilin |
Songyuan |
16.26 |
Moderate |
|
|
172 |
Chongqing |
Chongqing |
13.84 |
Moderate |
214 |
Gansu |
Pingliang |
16.33 |
Moderate |
|
|
173 |
Gansu |
Lanzhou |
13.86 |
Moderate |
215 |
Shaanxi |
Yulin |
16.34 |
Moderate |
|
|
174 |
Henan |
Xuchang |
13.89 |
Moderate |
216 |
Sichuan |
Meishan |
16.38 |
Moderate |
|
|
175 |
Hubei |
Tianmen |
13.95 |
Moderate |
217 |
Jiangxi |
Nanchang |
16.45 |
Moderate |
|
|
176 |
Hubei |
Qianjiang |
13.96 |
Moderate |
218 |
Henan |
Zhengzhou |
16.45 |
Moderate |
|
|
177 |
Guizhou |
Guiyang |
14.02 |
Moderate |
219 |
Inner Mongolia |
Huhehaote |
16.46 |
Moderate |
|
|
178 |
Jilin |
Baicheng |
14.11 |
Moderate |
||||||
|
179 |
Zhejiang |
Huzhou |
14.12 |
Moderate |
220 |
Xinjiang |
Kezileisu |
16.48 |
Moderate |
|
|
180 |
Sichuan |
Neijiang |
14.23 |
Moderate |
221 |
Henan |
Shangqiu |
16.51 |
Moderate |
|
|
181 |
Heilongjiang |
Shuangyashan |
14.29 |
Moderate |
222 |
Ningxia |
Zhongwei |
16.53 |
Moderate |
|
|
182 |
Guangxi |
Liuzhou |
14.36 |
Moderate |
223 |
Shandong |
Weihai |
16.79 |
Moderate |
|
|
183 |
Hainan |
Qiongzhong |
14.45 |
Moderate |
224 |
Inner Mongolia |
Chifeng |
16.79 |
Moderate |
|
|
184 |
Fujian |
Zhangzhou |
14.51 |
Moderate |
||||||
|
185 |
Shandong |
Laiwu |
14.51 |
Moderate |
225 |
Hainan |
Danzhou |
16.91 |
Relatively Poor |
|
|
186 |
Shandong |
Jinan |
14.51 |
Moderate |
||||||
|
187 |
Sichuan |
Chengdu |
14.62 |
Moderate |
226 |
Henan |
Zhoukou |
16.91 |
Relatively Poor |
|
|
188 |
Sichuan |
Zigong |
14.66 |
Moderate |
||||||
|
189 |
Guangxi |
Yulin |
14.74 |
Moderate |
227 |
Henan |
Xinyang |
16.92 |
Relatively Poor |
|
|
190 |
Henan |
Luohe |
14.74 |
Moderate |
||||||
|
191 |
Jiangsu |
Nanjing |
14.81 |
Moderate |
228 |
Xinjiang |
Kashen |
16.99 |
Relatively Poor |
|
|
192 |
Zhejiang |
Wenzhou |
15.00 |
Moderate |
||||||
|
193 |
Fujian |
Putian |
15.01 |
Moderate |
229 |
Heilongjiang |
Yichun |
17.07 |
Relatively Poor |
|
|
194 |
Liaoning |
Chaoyang |
15.01 |
Moderate |
||||||
|
195 |
Hainan |
Baoting |
15.02 |
Moderate |
230 |
Zhejiang |
Ningbo |
17.12 |
Relatively Poor |
|
|
196 |
Hubei |
Huangshi |
15.04 |
Moderate |
||||||
|
197 |
Anhui |
Anqing |
15.08 |
Moderate |
231 |
Xinjiang |
Aleitai |
17.23 |
Relatively Poor |
|
|
198 |
Ningxia |
Yinchuan |
15.19 |
Moderate |
||||||
|
199 |
Jiangsu |
Zhenjiang |
15.22 |
Moderate |
232 |
Anhui |
Bangbu |
17.35 |
Relatively Poor |
|
|
200 |
Shandong |
Jining |
15.27 |
Moderate |
||||||
|
201 |
Hubei |
Ezhou |
15.34 |
Moderate |
233 |
Heilongjiang |
Qitaihe |
17.37 |
Relatively Poor |
|
|
202 |
Jiangxi |
Xinyu |
15.44 |
Moderate |
||||||
|
203 |
Guangxi |
Baise |
15.45 |
Moderate |
234 |
Henan |
Xinxiang |
17.51 |
Relatively Poor |
|
|
204 |
Guangxi |
Hezhou |
15.52 |
Moderate |
||||||
|
205 |
Henan |
Jiaozuo |
15.70 |
Moderate |
235 |
Anhui |
Huaibei |
17.61 |
Relatively Poor |
|
|
206 |
Hubei Xiaogan 15.72 Moderate |
|||||||||
|
Rank Province City Score Level |
|
Rank Province City Score Level |
||||||||
|
236 |
Jiangsu |
Taizhou |
17.70 |
Relatively Poor |
257 |
Hainan |
Chengmai |
19.10 |
Relatively Poor |
|
|
237 |
Inner Mongolia |
Baotou |
17.84 |
Relatively Poor |
258 |
Guangdong |
Maoming |
19.24 |
Relatively Poor |
|
|
238 |
Henan |
Luoyang |
17.95 |
Relatively Poor |
259 |
Hubei |
Jingzhou |
19.33 |
Relatively Poor |
|
|
239 |
Inner Mongolia |
E’erduosi |
17.97 |
Relatively Poor |
260 |
Shaanxi |
Yan'an |
19.38 |
Relatively Poor |
|
|
240 |
Gansu |
Baiyin |
18.07 |
Relatively Poor |
261 |
Liaoning |
Tieling |
19.41 |
Relatively Poor |
|
|
241 |
Henan |
Zhumadian |
18.08 |
Relatively Poor |
262 |
Liaoning |
Liaoyang |
19.42 |
Relatively Poor |
|
|
242 |
Guangxi |
Beihai |
18.16 |
Relatively Poor |
263 |
Hainan |
Wanning |
19.43 |
Relatively Poor |
|
|
243 |
Ningxia |
Guyuan |
18.23 |
Relatively Poor |
264 |
Hebei |
Handan |
19.57 |
Relatively Poor |
|
|
244 |
Yunnan |
Yuxi |
18.27 |
Relatively Poor |
265 |
Guangdong |
Jiangmen |
19.58 |
Relatively Poor |
|
|
245 |
Anhui |
Fuyang |
18.36 |
Relatively Poor |
266 |
Hebei |
Baoding |
19.81 |
Relatively Poor |
|
|
246 |
Zhejiang |
Hangzhou |
18.43 |
Relatively Poor |
267 |
Anhui |
Chizhou |
19.86 |
Relatively Poor |
|
|
247 |
Heilongjiang |
Heihe |
18.49 |
Relatively Poor |
268 |
Jilin |
Liaoyuan |
19.94 |
Relatively Poor |
|
|
248 |
Beijing |
Beijing |
18.60 |
Relatively Poor |
269 |
Heilongjiang |
Ha’erbin |
20.06 |
Relatively Poor |
|
|
249 |
Henan |
Jiyuan |
18.63 |
Relatively Poor |
270 |
Shanxi |
Jincheng |
20.11 |
Relatively Poor |
|
|
250 |
Hainan |
Lingao |
18.76 |
Relatively Poor |
271 |
Shandong |
Yantai |
20.46 |
Relatively Poor |
|
|
251 |
Yunnan |
Dali |
18.77 |
Relatively Poor |
272 |
Yunnan |
Honghe |
20.50 |
Relatively Poor |
|
|
252 |
Guangxi |
Qinzhou |
18.82 |
Relatively Poor |
273 |
Liaoning |
Dalian |
20.53 |
Relatively Poor |
|
|
253 |
Guangdong |
Foshan |
18.85 |
Relatively Poor |
274 |
Shanxi |
Jinzhong |
20.54 |
Relatively Poor |
|
|
254 |
Jiangsu |
Suzhou |
18.88 |
Relatively Poor |
275 |
Guangdong |
Zhongshan |
20.60 |
Relatively Poor |
|
|
255 |
Henan |
Hebi |
18.90 |
Relatively Poor |
276 |
Henan |
Kaifeng |
20.65 |
Relatively Poor |
|
|
256 |
Zhejiang Jiaxing 19.09 Relatively Poor |
277 |
Hubei |
Jingmen |
20.67 |
Relatively Poor |
||||
|
Rank Province City Score Level |
|
Rank Province City Score Level |
||||||||||||
|
278 |
Jiangsu |
Yancheng |
20.83 |
Relatively Poor |
299 |
Hainan |
Sansha |
22.67 |
Relatively Poor |
|||||
|
279 |
Henan |
Anyang |
20.89 |
Relatively Poor |
300 |
Liaoning |
Fushun |
22.79 |
Relatively Poor |
|||||
|
280 |
Jiangsu |
Lianyungang |
20.95 |
Relatively Poor |
301 |
Shanxi |
Luliang |
22.81 |
Relatively Poor |
|||||
|
281 |
Jiangsu |
Changzhou |
21.13 |
Relatively Poor |
302 |
Guangdong |
Shantou |
23.10 |
Relatively Poor |
|||||
|
282 |
Shanghai |
Shanghai |
21.40 |
Relatively Poor |
303 |
Xinjiang |
Shihezi |
23.10 |
Relatively Poor |
|||||
|
283 |
Yunnan |
Kunming |
21.43 |
Relatively Poor |
304 |
Shanxi |
Shuozhou |
23.12 |
Relatively Poor |
|||||
|
284 |
Hebei |
Tangshan |
21.48 |
Relatively Poor |
305 |
Guangdong |
Jieyang |
23.12 |
Relatively Poor |
|||||
|
285 |
Gansu |
Qingyang |
21.48 |
Relatively Poor |
306 |
Guangdong |
Chaozhou |
23.19 |
Relatively Poor |
|||||
|
286 |
Heilongjiang |
Qiqiha’er |
21.49 |
Relatively Poor |
307 |
Jiangsu |
Nantong |
23.26 |
Relatively Poor |
|||||
|
287 |
Liaoning |
Fuxin |
21.50 |
Relatively Poor |
308 |
Shanxi |
Linfen |
23.32 |
Relatively Poor |
|||||
|
288 |
Heilongjiang |
Mudanjiang |
21.52 |
Relatively Poor |
309 |
Shaanxi |
Xi'an |
23.41 |
Relatively Poor |
|||||
|
289 |
Shandong |
Dongying |
21.56 |
Relatively Poor |
310 |
Liaoning |
Panjin |
23.43 |
Relatively Poor |
|||||
|
290 |
Sichuan |
Ziyang |
21.63 |
Relatively Poor |
311 |
Inner Mongolia |
Xilinguolei |
23.54 |
Relatively Poor |
|||||
|
291 |
Hainan |
Baisha |
21.71 |
Relatively Poor |
312 |
Shandong |
Zaozhuang |
23.63 |
Relatively Poor |
|||||
|
292 |
Gansu |
Tianshui |
21.76 |
Relatively Poor |
313 |
Tianjin |
Tianjin |
23.63 |
Relatively Poor |
|||||
|
293 |
Liaoning |
Jinzhou |
21.98 |
Relatively Poor |
314 |
Hubei |
Wuhan |
23.97 |
Relatively Poor |
|||||
|
294 |
Anhui |
Ma’anshan |
22.05 |
Relatively Poor |
315 |
Hainan |
Haikou |
24.26 |
Relatively Poor |
|||||
|
295 |
Shandong |
Zibo |
22.28 |
Relatively Poor |
316 |
Henan |
Puyang |
24.34 |
Relatively Poor |
|||||
|
296 |
Jiangsu |
Wuxi |
22.32 |
Relatively Poor |
317 |
Liaoning |
Huludao |
24.48 |
Relatively Poor |
|||||
|
297 |
Hebei |
Shijiazhuang |
22.53 |
Relatively Poor |
318 |
Jilin |
Jilin |
24.74 |
Relatively Poor |
|||||
|
298 |
Anhui Suzhou 22.58 Relatively Poor |
319 |
Jiangsu |
Yangzhou |
24.85 |
Poor |
||||||||
|
320 |
Shandong |
Qingdao |
25.27 |
Poor |
||||||||||
|
321 |
Hainan |
Sanya |
25.41 |
Poor |
||||||||||
|
Rank Province City Score Level |
|
Rank Province City Score Level |
||||||||||||
|
322 |
Anhui |
Hefei |
25.55 |
Poor |
344 |
Hebei |
Langfang |
29.97 |
Poor |
|||||
|
323 |
Anhui |
Bozhou |
25.71 |
Poor |
345 |
Hainan |
Wenchang |
30.08 |
Poor |
|||||
|
324 |
Heilongjiang |
Daqing |
25.83 |
Poor |
346 |
Hainan |
Qionghai |
30.78 |
Poor |
|||||
|
325 |
Shanxi |
Yuncheng |
26.10 |
Poor |
347 |
Heilongjiang |
Jiamusi |
30.99 |
Poor |
|||||
|
326 |
Shanxi |
Taiyuan |
26.44 |
Poor |
348 |
Guangdong |
Guangzhou |
31.15 |
Poor |
|||||
|
327 |
Shanxi |
Datong |
26.47 |
Poor |
349 |
Liaoning |
Yingkou |
31.50 |
Poor |
|||||
|
328 |
Hainan |
Ledong |
26.50 |
Poor |
350 |
Inner Mongolia |
Wulanchabu |
32.39 |
Poor |
|||||
|
329 |
Shandong |
Weifang |
26.83 |
Poor |
||||||||||
|
330 |
Shandong |
Dezhou |
27.03 |
Poor |
351 |
Jilin |
Changchun |
32.42 |
Poor |
|||||
|
331 |
Hainan |
Lingshui |
27.14 |
Poor |
352 |
Hebei |
Cangzhou |
32.75 |
Poor |
|||||
|
332 |
Hainan |
Changjiang |
27.48 |
Poor |
353 |
Shandong |
Rizhao |
32.91 |
Poor |
|||||
|
333 |
Hebei |
Xingtai |
27.60 |
Poor |
354 |
Liaoning |
Anshan |
34.43 |
Poor |
|||||
|
334 |
Guangdong |
Huizhou |
27.65 |
Poor |
355 |
Jilin |
Siping |
34.59 |
Poor |
|||||
|
335 |
Shandong |
Binzhou |
27.66 |
Poor |
356 |
Hainan |
Tunchang |
35.01 |
Poor |
|||||
|
336 |
Shaanxi |
Weinan |
27.90 |
Poor |
357 |
Inner Mongolia |
Hulunbei’er |
35.93 |
Poor |
|||||
|
337 |
Shandong |
Heze |
27.93 |
Poor |
||||||||||
|
338 |
Shandong |
Liaocheng |
28.25 |
Poor |
358 |
Heilongjiang |
Suihua |
37.44 |
Poor |
|||||
|
339 |
Liaoning |
Shenyang |
28.57 |
Poor |
359 |
Hebei |
Hengshui |
38.54 |
Poor |
|||||
|
340 |
Hainan |
Ding'an |
28.64 |
Poor |
360 |
Guangdong |
Shenzhen |
39.42 |
Poor |
|||||
|
341 |
Ningxia |
Wuzhong |
28.90 |
Poor |
361 |
Inner Mongolia |
Tongliao |
40.81 |
Poor |
|||||
|
342 |
Guangdong |
Dongguan |
29.42 |
Poor |
||||||||||
|
343 |
Shaanxi |
Tongchuan |
29.86 |
Poor |
362 |
Shanxi Yangquan 41.92 Poor |
||||||||
Disclaimer:
This report has been translated by IPE for the purposes of reference only. Any discrepancies or differences created in the translation are not binding and have no legal effect. If any such questions arise, please refer to the Chinese version of the document, which is the official version of the document.
For a complete list of sources, please refer to the Chinese version of this report.
Notes :
1 Some regions lack data from 2018, in which case data from 2017 or earlier was used instead.
2 Some regions have not published data on their present status, in which case 2020 water quality targets were used instead.
3 Including counties under provincial jurisdiction and the Xinjiang Production and Construction Corps.
4 MEE classifies surface water and groundwater quality into five standards, with Class I as the highest quality. For more details, please refer to the MEE documents:
http://kjs.mee.gov.cn/hjbhbz/bzwb/shjbh/shjzlbz/200206/t20020601_66497.shtml
http://kjs.mee.gov.cn/hjbhbz/bzwb/shjbh/shjzlbz/199410/t19941001_66500.shtml
5 2018 China Report on the State of the Environment http://www.mee.gov.cn/hjzl/zghjzkgb/lnzghjzkgb/